Choosing a last mile delivery service in 2026 will require more than comparing delivery prices. Parcel networks are handling greater volume, tighter customer expectations, and more complex urban routes. Pitney Bowes’ Parcel Shipping Index reported 161.8 billion parcels worldwide in 2023, showing the scale behind every doorstep handoff. The World Economic Forum also projects urban delivery traffic and emissions will rise sharply without better routing and vehicle efficiency. These figures make reliability, not speed alone, a practical buying criterion.
A strong provider should prove performance with recent, lane-specific data. Ask for on-time delivery rates, first-attempt success, damage frequency, and average exception-resolution time. Check whether drivers provide accurate GPS scans, photographs, and recipient confirmation. Test the customer journey with a small shipment. Watch the tracking page when a package misses its delivery window. That moment reveals more than a polished sales presentation.
Technology matters, but integration quality matters more. The service should connect cleanly with your order system, inventory tools, returns workflow, and customer notifications. Request evidence from comparable retailers, not only broad case studies. DHL’s Logistics Trend Radar highlights automation, data visibility, and sustainable transport as continuing logistics priorities. Still, sustainability claims need verification through vehicle records, route reports, and emissions methodology. A cheaper offer may create expensive support tickets, failed deliveries, and abandoned purchases. That risk is easy to underestimate.
Choose a partner that can scale during promotional peaks while maintaining human support. Review insurance terms, data protection practices, service-level remedies, and regional coverage before signing. No provider performs perfectly. The better choice is transparent, measurable, and willing to improve when the route becomes difficult.
How to Choose a Last Mile Delivery Service in 2026?
Define Scope: Global Parcel Volume Reached 161.8B in 2022
Global parcel volume reached 161.8 billion shipments in 2022, according to the 2023 Parcel Shipping Index. That figure changes the selection process. A delivery provider must match your actual operating scope, not just offer a low headline rate. Map your shipment lanes, daily volume, package dimensions, delivery windows, and return frequency. Include seasonal peaks. A service that handles 500 parcels daily may struggle with 5,000 during a sales event.
Start with evidence.
Request delivery scans, exception reports, and country-level performance data. Compare first-attempt delivery rates, average transit times, damage claims, and customer-service response times. The World Economic Forum estimates urban delivery traffic could rise by 36% by 2030 without operational changes. Route density and delivery precision therefore matter. Ask how the provider manages apartment access, rural addresses, failed attempts, and real-time recipient updates.
Do not ignore returns. They expose weak processes quickly. Test a small pilot across several regions before signing a long contract. Measure results for at least four weeks. Check whether tracking events arrive late or lack useful detail. That happens more often than procurement teams expect. Cost models can also mislead when fuel adjustments, residential fees, remote-area charges, or return handling appear later. The best choice may not be the cheapest shipment. It should be the most predictable one for your customers and your internal team.
Define Scope: Global parcel volume reached 161.8 billion in 2022.
Global parcel shipments increased substantially from 2018 to 2022, with the strongest acceleration occurring during 2020 and 2021. When evaluating a last mile delivery service in 2026, use total addressable parcel volume, peak-season capacity, geographic coverage, delivery speed, tracking quality, and returns handling as core selection criteria.
Source: Published global parcel-market research estimates. Figures are rounded and shown in billions of parcels.
Choosing a last-mile delivery service in 2026 should begin with measurable outcomes, not promises. McKinsey estimates that last-mile delivery can represent over half of total shipping costs. That cost deserves scrutiny.
Set four KPIs: delivery speed, order accuracy, damage rate, and first-attempt success. Measure speed from dispatch to doorstep, not from warehouse release. Track the median and the 90th-percentile time. Averages can hide late rural routes. For accuracy, audit address, item, quantity, and delivery-window errors separately. The Pitney Bowes Parcel Shipping Index recorded more than 160 billion parcels globally in 2023, so small error rates can create substantial costs.
Use photo evidence and customer claims to calculate damage per 1,000 parcels. Record packaging failures by route, vehicle, and handling point. First-attempt success needs a clear denominator: delivered on the first scheduled attempt divided by all scheduled deliveries. DHL’s 2024 E-Commerce Trends Report found that 81% of shoppers may abandon carts when preferred delivery options are unavailable. Flexible scheduling can therefore improve this KPI, but it may increase operating costs. That trade-off needs testing. I would review four weeks of route-level data before signing a long contract. A polished dashboard is not proof of reliable service. Sometimes, the uncomfortable numbers are the useful ones.
A low delivery rate can hide expensive operational problems. Calculate the full cost before choosing a last mile service. Include the base rate, fuel surcharge, residential fees, and peak-period adjustments. Then add packaging, address corrections, and customer communication costs. A delivery priced at $6 may cost $9 after these items are included.
Returns require special attention. Measure the cost of collecting, inspecting, storing, and reshipping each parcel. Failed deliveries also create labor costs and damage customer trust. Review historical data by postcode, delivery window, parcel size, and recipient type. In my experience, rural routes often look efficient on paper but become costly when drivers face long distances and missed handoffs. Our estimates were not perfect. We underestimated reattempts during busy periods.
Tips: Build three cost scenarios: normal, peak, and failure-heavy. Ask for clear definitions of every fee. Test the calculation with real invoices, not only quoted rates. Track cost per successful delivery, not cost per attempted delivery. Leave room for mistakes. Forecasts can be too optimistic. A reliable provider should explain assumptions, report exceptions, and share measurable service data. Check whether return fees change by parcel type. Small details can shift the final cost significantly.
When choosing a last mile delivery service in 2026, test capacity under tomorrow’s pressure, not today’s average. The World Economic Forum forecasts 36% more urban delivery vehicles by 2030. Its Future of the Last-Mile Ecosystem report also warns of 21% higher congestion and 32% higher emissions. Those figures change the buying question. Can the provider absorb a sudden evening surge without filling every curb with vans? Field audits often reveal weak capacity at 5 p.m., when parcels wait beside loading doors. Promises look polished; scan timestamps are harder to fake.
Ask for lane-level evidence from the past six months. Review successful deliveries per hour, failed-attempt rates, driver availability, and vehicle utilization. Request separate results for rain, holidays, apartment towers, and low-density streets. The International Transport Forum’s Transport Outlook 2023 links growing urban freight demand with continuing pressure on city networks. That makes flexible capacity essential. Look for spare drivers, adaptable vehicle classes, and dispatch rules that protect delivery windows. Do not accept one national average. Local performance is the real test.
Tips: Run a paid pilot across three contrasting districts. Set a volume spike of 30% for one week. Measure on-time delivery, curb dwell time, customer contacts, and emissions per parcel. Compare baseline and surge results. Leave room for uncomfortable findings. A service may pass normal days yet fail during rain, festivals, or a new apartment launch. Also verify how it reports estimates, missing scans, and outsourced capacity. Transparent data supports practical experience, technical judgment, authoritative evidence, and reliable decisions.
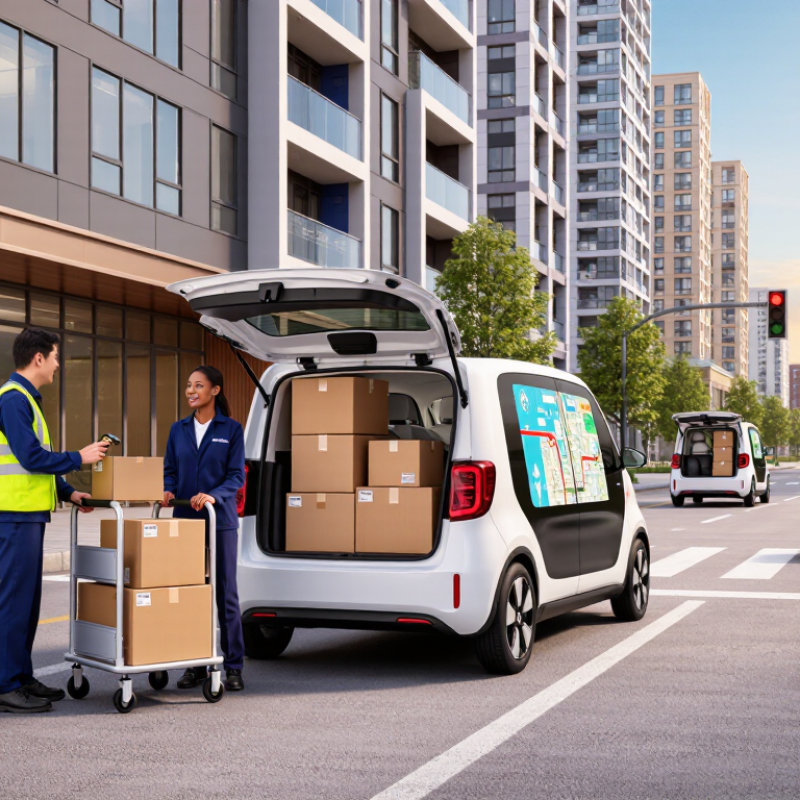
Choosing a last-mile service in 2026 requires more than a delivery promise. Technology should make each parcel visible from dispatch to doorstep. Require real-time tracking with location timestamps, status changes, and exception alerts. A vague “in transit” label is not useful during a missed delivery. Ask how often location data refreshes. Can customers receive accurate arrival windows? Trust needs evidence.
During a practical pilot, test tracking at a loading bay, an apartment lobby, and a failed handoff. The system should record scans, driver notes, proof of delivery, and recipient contact attempts. Check whether updates remain available during weak mobile coverage. A polished dashboard can still hide gaps. Request sample reports, access controls, retention rules, and incident response procedures. Independent audits or documented service-level results strengthen confidence.
ESG claims need measurable emissions data, not broad environmental language. Request emissions per parcel, route, distance, vehicle type, and delivery outcome. Clarify whether calculations use fuel records, mileage, or estimates. Different methods can produce very different numbers. Data can mislead. A failed delivery may create a second trip and higher emissions. Review monthly trends against order density, delivery speed, and return rates. Leave room for correction. No provider is perfectly transparent, and that limitation should influence the evaluation.
| Evaluation Dimension | Procurement Requirement for 2026 | Measurable Data Point | Evidence to Request | Assessment Guidance |
|---|---|---|---|---|
| Real-Time Shipment Tracking | Tracking must be available through a web portal and a machine-readable API or webhook. | Location and status events refreshed at least every 5 minutes while a delivery is in progress. | Live demonstration, API documentation, sample event payloads, and timestamped tracking records. | Pass if event timestamps, status history, and exception alerts are visible without manual carrier intervention. |
| Delivery Accuracy | The system must record pickup, attempted delivery, successful delivery, recipient confirmation, and reason codes for exceptions. | Monthly on-time delivery rate, first-attempt delivery rate, and scan completeness rate. | At least 90 days of anonymized operational reports and definitions for every KPI. | Do not accept a KPI unless its denominator, time window, service area, and exclusion rules are documented. |
| Proof of Delivery | Proof of delivery must be digitally linked to the shipment identifier and protected from unauthorized alteration. | Percentage of completed deliveries with timestamp, GPS position, recipient confirmation, and optional image evidence. | Redacted proof-of-delivery samples, retention policy, audit trail, and access-control documentation. | Check that proof is retrievable by shipment ID and that edits create an auditable history. |
| Emissions Measurement | Emissions reporting should quantify transport-related greenhouse-gas emissions using a documented, repeatable methodology. | Grams of CO2e per parcel, per delivery stop, and per tonne-kilometre where applicable. | Methodology statement, activity data, emission factors, allocation rules, assumptions, and calculation examples. | Prefer calculations aligned with ISO 14083:2023 and compatible with the GHG Protocol Scope 3 transportation categories. |
| Emissions Data Quality | Reported emissions must distinguish measured activity data from estimates and disclose the level of data quality. | Share of emissions calculated from primary data versus secondary emission factors. | Data lineage, vehicle-fuel or electricity records, distance calculations, load factors, and factor sources. | Require a clear explanation when route distance, vehicle type, fuel use, package weight, or load factor is estimated. |
| Low-Emission Delivery Options | The service should provide lower-emission delivery modes where operationally feasible. | Percentage of eligible deliveries completed using electric vehicles, cargo bikes, walking routes, or consolidated drop-off points. | Mode-by-mode volume report, eligibility rules, geographic coverage, and evidence of vehicle or route activity. | Compare performance only across similar delivery zones, parcel profiles, service levels, and reporting periods. |
| Integration and Data Portability | Shipment, tracking, exception, proof-of-delivery, and emissions data must be exportable in standard machine-readable formats. | API availability, webhook support, export formats, field-level documentation, and maximum data latency. | API test environment, data dictionary, authentication method, service-level commitments, and export sample. | Pass if data can be transferred without dependence on manually downloaded screenshots or proprietary files. |
| Data Security and Privacy | Personal data in delivery records must be minimized, access-controlled, encrypted in transit, and retained only as long as required. | Encryption controls, role-based access, incident-notification period, retention period, and deletion process. | Security policy, privacy notice, data-processing terms, access logs, and independent security assessment where available. | Verify the legal basis and geographic handling of recipient names, addresses, phone numbers, signatures, and images. |
| Reporting and Auditability | Operational and ESG reports must be reproducible from archived source data. | Report frequency, historical retention period, correction workflow, and audit-trail coverage. | Sample monthly report, raw-data extract, calculation workbook or logic description, and change log. | Require the provider to explain how corrected tracking or emissions records are identified and reissued. |
| Service Resilience | The provider must maintain tracking, exception handling, and data recovery during operational disruptions. | System availability target, recovery time objective, recovery point objective, and backup frequency. | Business-continuity plan, incident history, service-level agreement, and results of recovery testing. | Evaluate resilience separately for physical delivery operations and digital tracking infrastructure. |