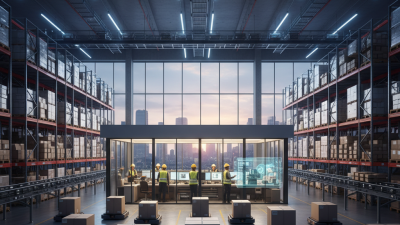
Why Use a Last Mile Delivery Service?
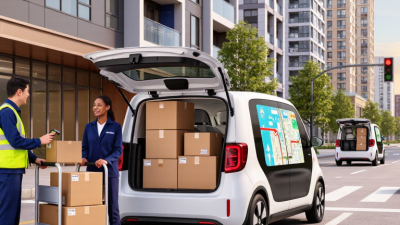
The final stretch of delivery often decides how customers remember a brand. A parcel can travel thousands of miles smoothly, then fail beside one apartment door. It may arrive late, miss the customer, or sit exposed in rain. A reliable last mile delivery service manages this vulnerable stage with local knowledge, route planning, driver coordination, and real-time tracking.
John Manners-Bell, chief executive of Transport Intelligence, describes the challenge clearly: “The last mile is the most expensive and least efficient part of the delivery process.” His observation reflects daily logistics experience. Urban congestion, narrow delivery windows, failed attempts, and rising customer expectations create constant pressure. Professional providers can combine delivery data with practical judgment. They may group nearby stops, send accurate arrival updates, and offer safer handover options. These details reduce uncertainty for both businesses and customers.
The benefits are measurable, but not automatic. Faster delivery does not always mean better delivery. A rushed route can increase errors, fuel use, and driver fatigue. That weakness deserves attention. Companies should compare success rates, delivery visibility, customer feedback, and environmental performance before choosing a partner. A last mile delivery service should also communicate honestly when delays occur. Perfect logistics is unrealistic. Consistent improvement is more credible. When the final handoff feels simple, visible, and dependable, customers gain confidence in the entire brand.
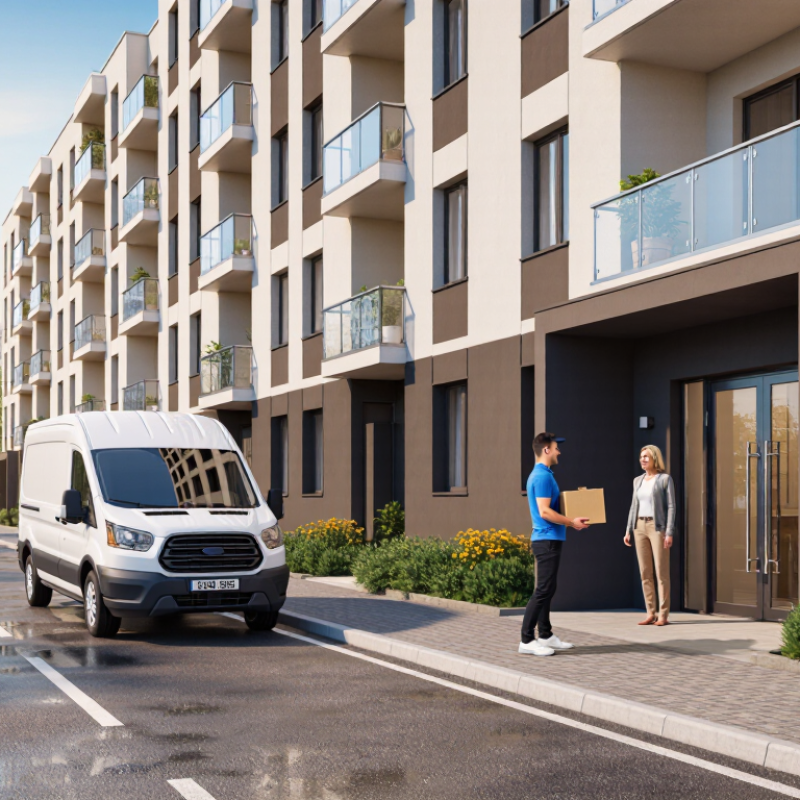
Last-mile delivery covers the final movement from a local facility to the customer’s address. It sounds simple, but this stage often creates the most pressure. McKinsey reports that last-mile activities can represent about 53% of total shipping costs. The figure varies by product, distance, delivery speed, and market conditions. Still, it shows why this stage deserves close attention. A short route can become expensive when drivers face traffic, missed deliveries, unclear addresses, or repeated attempts.
A professional last-mile delivery service can combine route planning, delivery tracking, driver coordination, and customer updates. In practical operations, these tools help reduce empty mileage and improve arrival accuracy. They also create useful records, such as delivery times, delay reasons, and successful handoffs. Managers can review this information and adjust staffing or service windows. The process is not perfect. Forecasts can fail during storms, peak seasons, or sudden demand changes. That weakness should be measured, not hidden. Reliable data supports better decisions than optimistic assumptions.
81% delivery-choice abandonment rate should concern every online retailer. It suggests that many shoppers leave when delivery options feel unclear, slow, or inconvenient. A product may be excellent, yet the final checkout screen can still lose the sale.
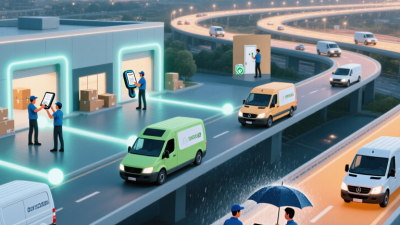
Customers now expect control over the last mile. They want accurate time windows, safe drop-off instructions, pickup alternatives, and simple address changes. In practical terms, a missed delivery can mean a locked office, a rushed commute, or a package left outside in the rain. A professional last mile delivery service can coordinate these details through tracking, route planning, and customer notifications.
Small details matter. A clear delivery fee should appear before payment. Estimated arrival times should reflect real operating conditions, not optimistic guesses. Businesses should also test checkout with ordinary customers, because internal teams often understand delivery systems too well. That is an uncomfortable weakness.
The 81% figure should not be treated as a universal rule. Survey design, market conditions, and product type can affect the result. Still, it reveals a serious pattern: delivery choice is part of the buying experience, not an afterthought. When options are confusing, customers may abandon the order quietly, without explaining why.
Delivery models should be compared by cost, speed, coverage, and scalability. McKinsey reports that last-mile delivery can represent more than half of total shipping costs. Dense urban routes may reduce cost per parcel, while rural stops create longer distances and lower vehicle utilization. A scheduled fleet offers control and predictable service, but it requires vehicles, drivers, maintenance, and local management. Crowdsourced delivery can expand capacity quickly, although quality may vary between locations.
Speed depends on network design. A centralized warehouse usually costs less, but orders travel farther. Local hubs can support same-day delivery within a small radius. That speed comes with higher handling and inventory expenses. The World Economic Forum projects urban last-mile delivery demand will grow sharply by 2030, increasing congestion and emissions without better route planning. Fast is not always efficient.
Coverage reveals another trade-off. Regional carriers may serve remote areas better than an internal fleet. However, adding multiple providers can complicate tracking and customer support. Scalability is strongest when systems connect order data, route planning, proof of delivery, and returns. Pitney Bowes recorded more than 160 billion parcels worldwide in 2022, showing how quickly networks must adapt. Yet scale can hide weak service. A missed delivery at a quiet suburban door still damages trust. Teams should test real routes, measure failed attempts, and revise assumptions before expanding.
Why Use a Last Mile Delivery Service?
Evaluate Route Optimization’s Potential to Reduce Delivery Costs by 10–40%
Last mile delivery often consumes the largest share of logistics expenses. Drivers face traffic, failed handoffs, narrow delivery windows, and scattered addresses. Route optimization software can arrange stops by distance, time limits, vehicle capacity, and road conditions. In suitable networks, operators may reduce delivery costs by 10–40%. The actual result depends on route density, data quality, and driver compliance.
Small changes become visible on the road. A driver carrying 45 parcels may avoid three unnecessary crossings across town. A dispatch team can group nearby apartment buildings into one delivery sequence. Live traffic updates may prevent a 20-minute delay near a busy junction. Fewer miles also mean lower fuel use, reduced overtime, and less vehicle wear. These savings are measurable through mileage reports, delivery time, fuel records, and failed-delivery rates.
The number is not guaranteed. Poor address data can create bad routes. Customers may change schedules after dispatch. A mathematically efficient route can still frustrate drivers if loading order is ignored. Human review remains important, especially during storms, road closures, or unusual demand. Pilot testing is safer than making a broad promise. Compare several weeks of baseline results with optimized performance. Check cost per stop, on-time delivery, customer complaints, and driver feedback. Some routes improve quickly. Others need better data first.
| Operating Scenario | Typical Stops per Route | Baseline Route Distance | Optimized Distance | Distance Reduction | Estimated Cost per Stop Before | Estimated Cost per Stop After | Potential Cost Reduction |
|---|---|---|---|---|---|---|---|
| Dense urban delivery | 80–120 | 45–70 mi | 30–50 mi | 20–35% | $5.00–$7.00 | $3.50–$5.50 | 20–30% |
| Suburban multi-stop delivery | 45–80 | 75–120 mi | 50–85 mi | 25–40% | $7.00–$10.00 | $4.50–$7.50 | 25–35% |
| Rural or geographically dispersed delivery | 20–45 | 120–220 mi | 85–165 mi | 20–35% | $12.00–$20.00 | $8.00–$15.00 | 20–30% |
| Time-window constrained delivery | 35–70 | 65–110 mi | 45–80 mi | 20–35% | $8.00–$12.00 | $5.50–$9.00 | 25–40% |
| Mixed fleet and capacity-constrained delivery | 40–90 | 80–140 mi | 55–100 mi | 20–35% | $7.50–$13.00 | $5.00–$9.50 | 25–40% |
A last mile delivery service should prove its value with measurable results. Track cost per stop, labor hours, fuel use, and failed delivery attempts. These figures show whether outsourced delivery reduces operational pressure or simply moves costs elsewhere. A weekly review can reveal patterns, such as extra mileage caused by narrow delivery windows.
Emissions deserve equal attention. Measure fuel consumption, distance per parcel, and emissions per completed stop. Route density matters. Ten deliveries in one neighborhood usually create fewer emissions than ten scattered stops. Estimates may vary, so use the same calculation method each month. Our first emissions report was imperfect because vehicle data was incomplete. That weakness exposed a useful improvement opportunity.
Accuracy protects both margins and customer trust. Monitor successful first-attempt deliveries, scan errors, damaged parcels, and address corrections. A practical target should reflect real delivery conditions, not an attractive spreadsheet number. Retention connects these metrics to business value. Compare repeat-order rates, complaint frequency, and customer service contacts before and after service changes. Keep a control period when possible. Results can be influenced by seasonality, promotions, or weather. Cost savings alone may look impressive, but declining retention can quietly erase them. խնդրելի